









Wind & solar · China · 2040
If you've read One Piece, you already know the Calm Belt.
Those dead bands of sea with no wind and no current — where a ship can't sail, can't run, and the Sea Kings lie waiting below.
Not the storm.The calm.
Here's the part the manga got right: in reality, the calm is the dangerous bit too.
We built the cleanest power grid on Earth on the wind. So when the air goes still and the sky greys over, the calm doesn't strand a ship — it starves a grid.
For up to 24 days a year, wind and solar — on their way to 70% of China's power — quietly begin to fail.
Sun et al. 2026, Nature Communications · Fig. 2a–b + 6g · High
doi.org/10.1038/s41467-026-73427-z
A storm, at least, announces itself.
You see it coming. You brace. You ride it out.
The calm gives no warning at all.
The weather that takes it down doesn't look like weather at all.
Low wind. A sky that greys over and stays grey. Nothing a forecaster would call extreme.
Scientists have a name for it: a high-impact weather event.
Definition: Sun et al. 2026 · Introduction · High
Low wind starves the turbines.
Grey sky starves the panels.
High-impact weather brings both — at the same time. The backup you were counting on is down with the thing it was meant to back up.
In the hardest-hit regions, this isn't rare
That's roughly one day in fifteen with both of the biggest sources quiet at once — up to 12 separate events a year, mostly in winter and spring, inland, where the resources are richest.
Sun et al. 2026 · Fig. 2a–b (Northwest & China Southern grids) · High
No alarm. No damage.
Just… nothing coming in.
When the wind drops and the sky greys over — for days, for weeks —
where does the power come from?
Wind + solar supply vs demand · during an event
Across a year, these events erase 84.5 TWh of generation under the high-emissions path — and even the best case still loses 62.7 TWh.
Sun et al. 2026 · Fig. 2c (annual HIW generation losses) · High
Summer 2022 · the Sichuan basin
It has already happened.
Heat, drought and unbroken cloud cut the basin's wind and solar output by more than 35% at once — for ten straight weeks.
Sun et al. 2026 · Supplementary Note 4 + Introduction · High
The same week — daily average vs hour by hour
Hour by hour, the deficits run 10–15% deeper than the daily numbers admit — and they plunge below the security line in hours the average never sees.
Sun et al. 2026 · Fig. 4 (hourly vs daily, NW & Central grids) · High
Four · The Geography
The wind and the sun? They're out here.
The richest resources sit in the empty north and west — Inner Mongolia, the Northwest.
The people are over there.
A thousand kilometres east and south, on the crowded coast. Between them: almost nothing.
Where the power is made — and where it's needed
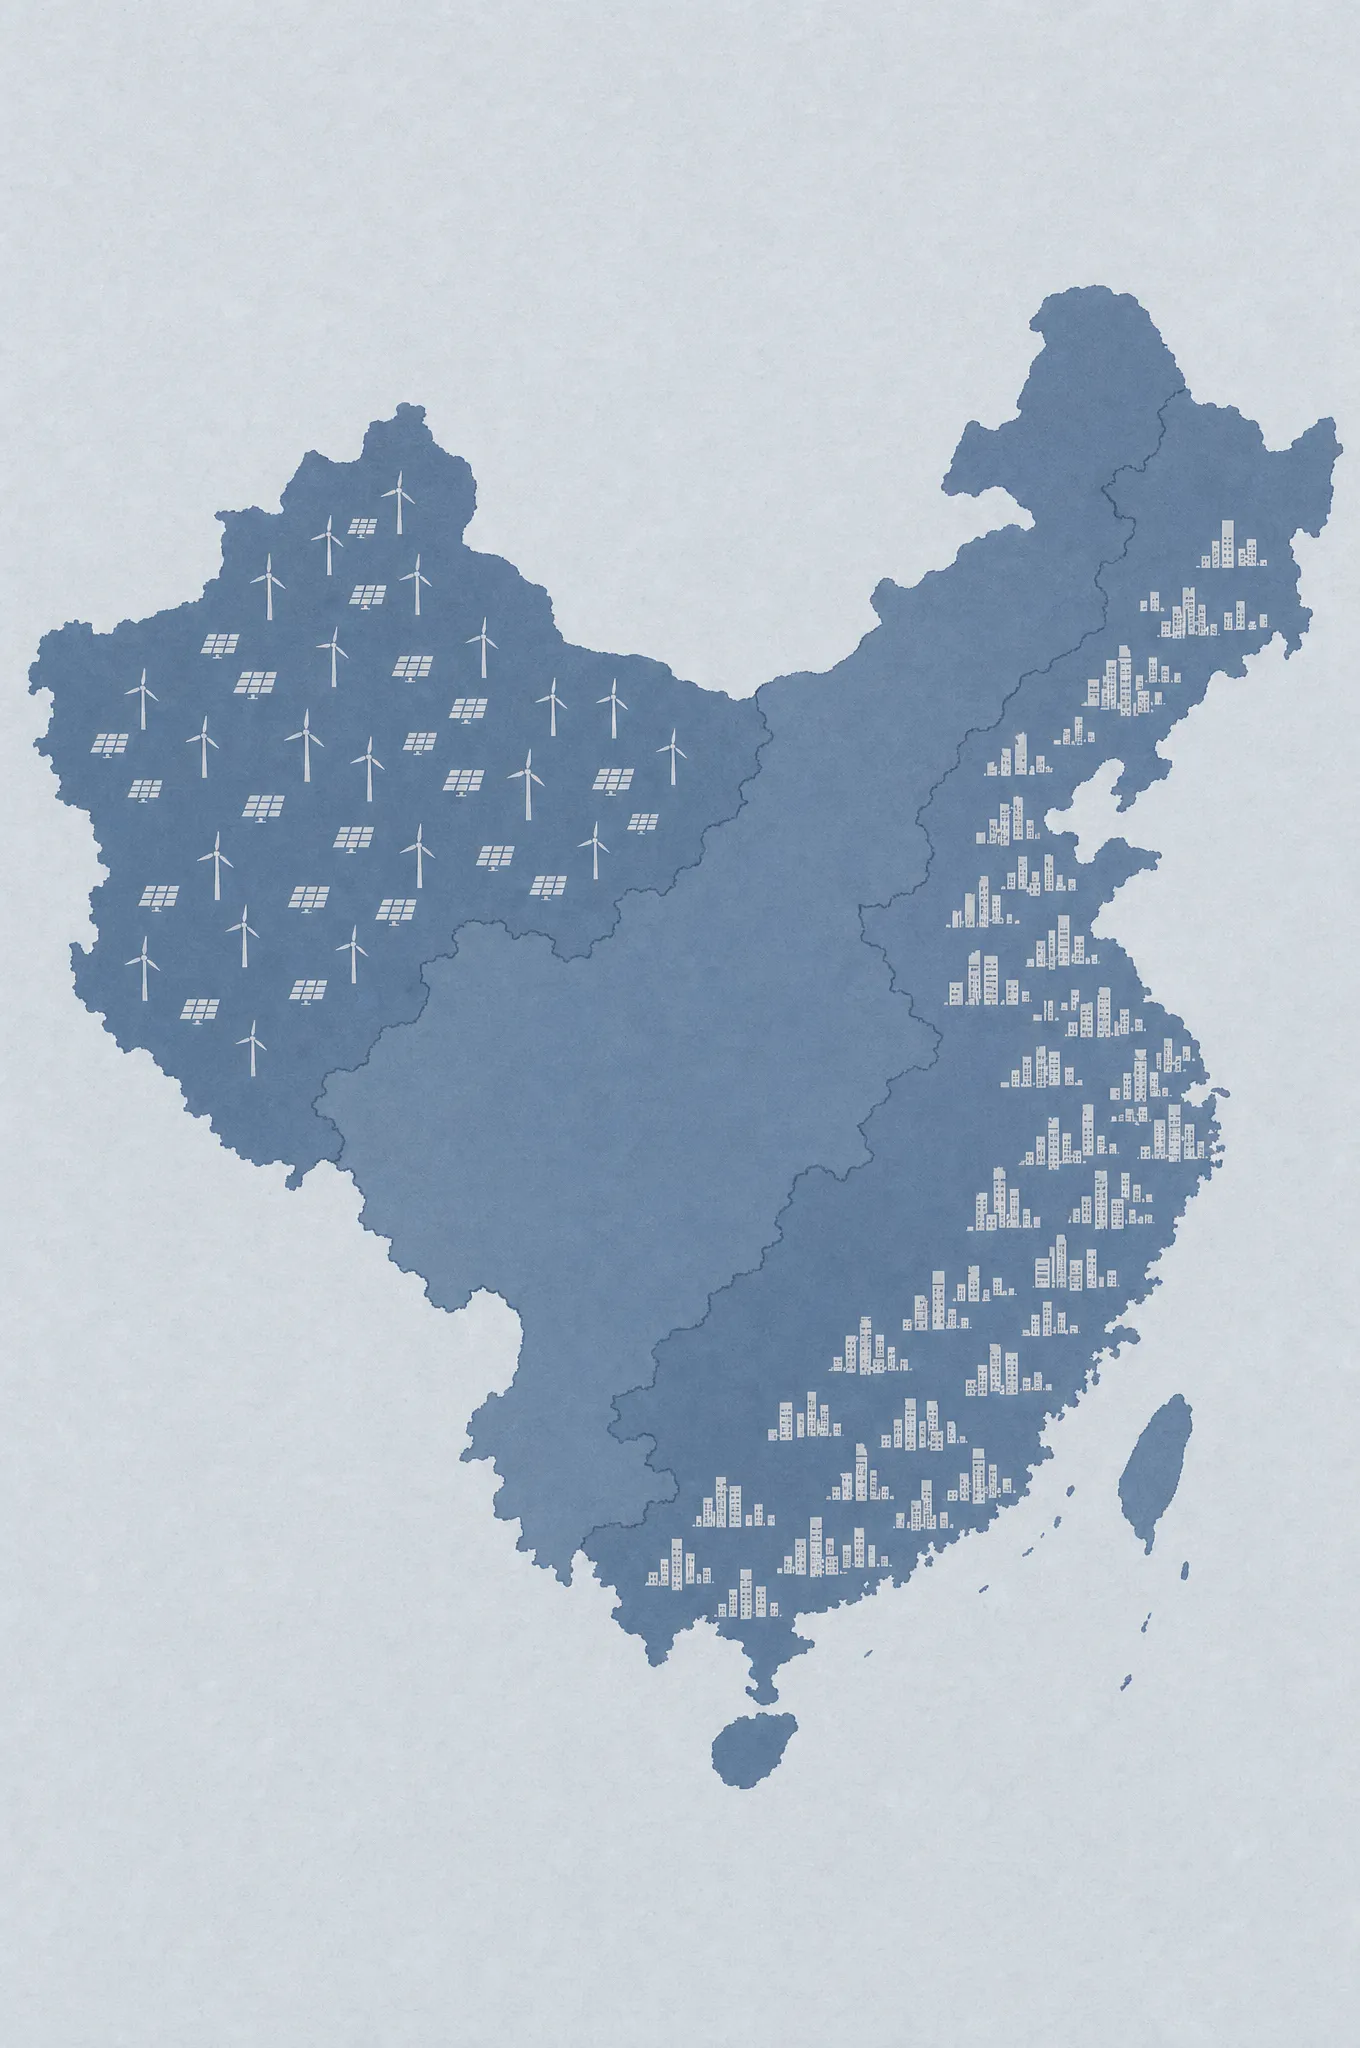
The shortfall clusters where the people are — Central China loses 404 GWh over 44 days, the south 426 over 43. The empty northwest barely feels it.
Sun et al. 2026 · Fig. 3–4 (regional deficits; NW & NE most resilient) · High
Every grid runs a deficit · worst first
swipe →
Seven grids, seven shortfalls — but the north and west, where the wind and sun are richest, ride them out best.
Sun et al. 2026 · Fig. 3b–h (cumulative regional deficits) · High
The problem was never how much you make.
It's the distance between where it's made and where it's needed. East China generates 343 TWh of its own — and still has to import 37 more from the north.
Sun et al. 2026 · Fig. 5 (inter-regional transfers) · High
So the real question isn't how much.
It's how you move it — in time.
Five · The Choreography
There is an answer.
It looks less like building more — and more like choreography.
Moving the surplus west → east
Inner Mongolia and the Northwest become the country's battery — wiring up to 605 gigawatts of reach toward the coast.
Sun et al. 2026 · Abstract + Fig. 5 · High
Annual deficit under high-impact weather
Siting and grid optimisation together cut the weather-driven deficit by ~28% — and push wind-and-solar from about half of the grid in the 2030s to 70% by 2060.
Sun et al. 2026 · Fig. 6a, 6g · High
But it's not a victory you win once.
Only the cost-effective corridors get built — the western and northern routes pay off; several southern ones don't. And even as the climate is reined in, the worst regions still lose 2–4 more days each year.
Sun et al. 2026 · Fig. 5 (corridor economics) + Fig. 4 · High
A clean grid isn't a finish line you cross.
It's a balance you hold — every hour, every winter.
The question was never whether China can build the cleanest grid on Earth.
It's whether it can keep holding it —
one quiet, windless, sunless week at a time.